The Renegade Ranking Engine part 2 is now available here
This is the first article for paid members only. At the bottom of the article, you will find a unique link to a private members-only website where I have added additional content and bonuses, including access to Niche Builder Live where you can follow along as I build a 7-figure blog live.
What I am going to share in this series of articles is the culmination of over six months of research and four months of testing on live websites.
Less than one per cent of sites on the Internet are implementing what I am about to show you, and doing so will give you a seriously unfair advantage over your competitors.
But before we get dug into this, let’s look at some statistics for a bit of background.
All of this data is from the HTTP Archive Web Almanac
Over the last 10 years, page weight has increased by 594%. Page weight is effectively the number of bytes transferred in total from the server, or servers, to the browser to render the page.
Page weight consists of:
The HTML that makes up the page itself
Images and other media (video, audio, etc) embedded into the page
Cascading Style Sheets (CSS) used for styling the page
JavaScript to provide interactivity
Third-Party resources containing one or more of the above.
The average size of a web page designed for the desktop in 2012, and all its loaded resources was 523kB, today it is a whopping 2,299kB, what's more, the typical mobile-friendly site is still coming in at 2001kB
With those kinds of numbers, it is no surprise that 53 per cent of all mobile page views are abandoned.
Over the last couple of years, Google has taken a mobile-first stance, and in 2021 announced that page experience was going to become a ranking factor and they are testing sites for Core Web Vitals.
These are; loading performance (how fast things appear on the screen, responsiveness (how fast the page reacts to user input), and visual stability (how much things move around on the screen when loading the page).
We will go over these in detail in a future article when I show you how to optimise a site, but for now, let’s take a look at how a typical site performs from Google’s point of view.
There are two ways of investigating a site, these are Google PageSpeed Insights and Lighthouse. I like to use both but the difference is:
Google PageSpeed Insights focuses on performance metrics and uses lab data complemented with real-world data experienced by users on the website to support the analysis.
Lighthouse measures additional things on top of performance but only uses lab data without any real-world examples to correlate the findings.
Let’s have a look at one of my competitor’s sites after being run through Lighthouse.
Now you may think that this is dire, but this is what most of the internet looks like. Good-performing sites will generally rank in the orange zone and only a few per cent in the green zone.
… drum roll please … 🥁🥁🥁
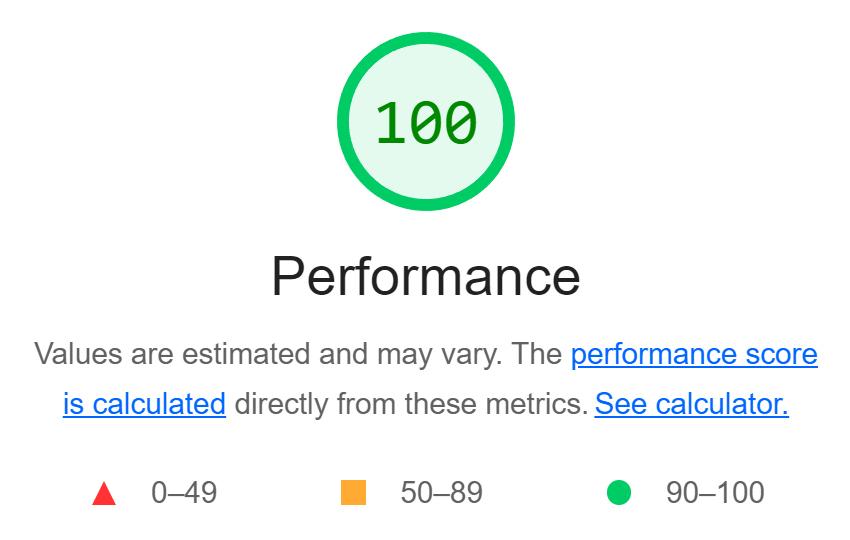
Here is what a Renegade Ranking Engine site looks like…
Now, this is a site that is optimized to an inch of its life to get that score, but typical pages are hitting 96-98 out of 100.
Hitting green across the board and analysing the rankings was the core of my research and tests, and the results show a significant boost in the SERPS when this happens. This is also true for pages with zero backlinks.
And all of the infrastructure for the Renegade Ranking Engine is in the cloud, on edge CDN servers, and costs absolutely zero to set up and run apart from your time.
Keep reading with a 7-day free trial
Subscribe to The Raine Report to keep reading this post and get 7 days of free access to the full post archives.


